 The Garden in Flagstaff Website Project

The Flagstaff National Weather Service (NWS) forecast office and The Arboretum at Flagstaff undertook this joint project to classify various microclimates around the Flagstaff area and deliver the information to the public. The project provides textual and visual climatological, meteorological, and land surface information to the public for purposes such as horticulture and construction planning.
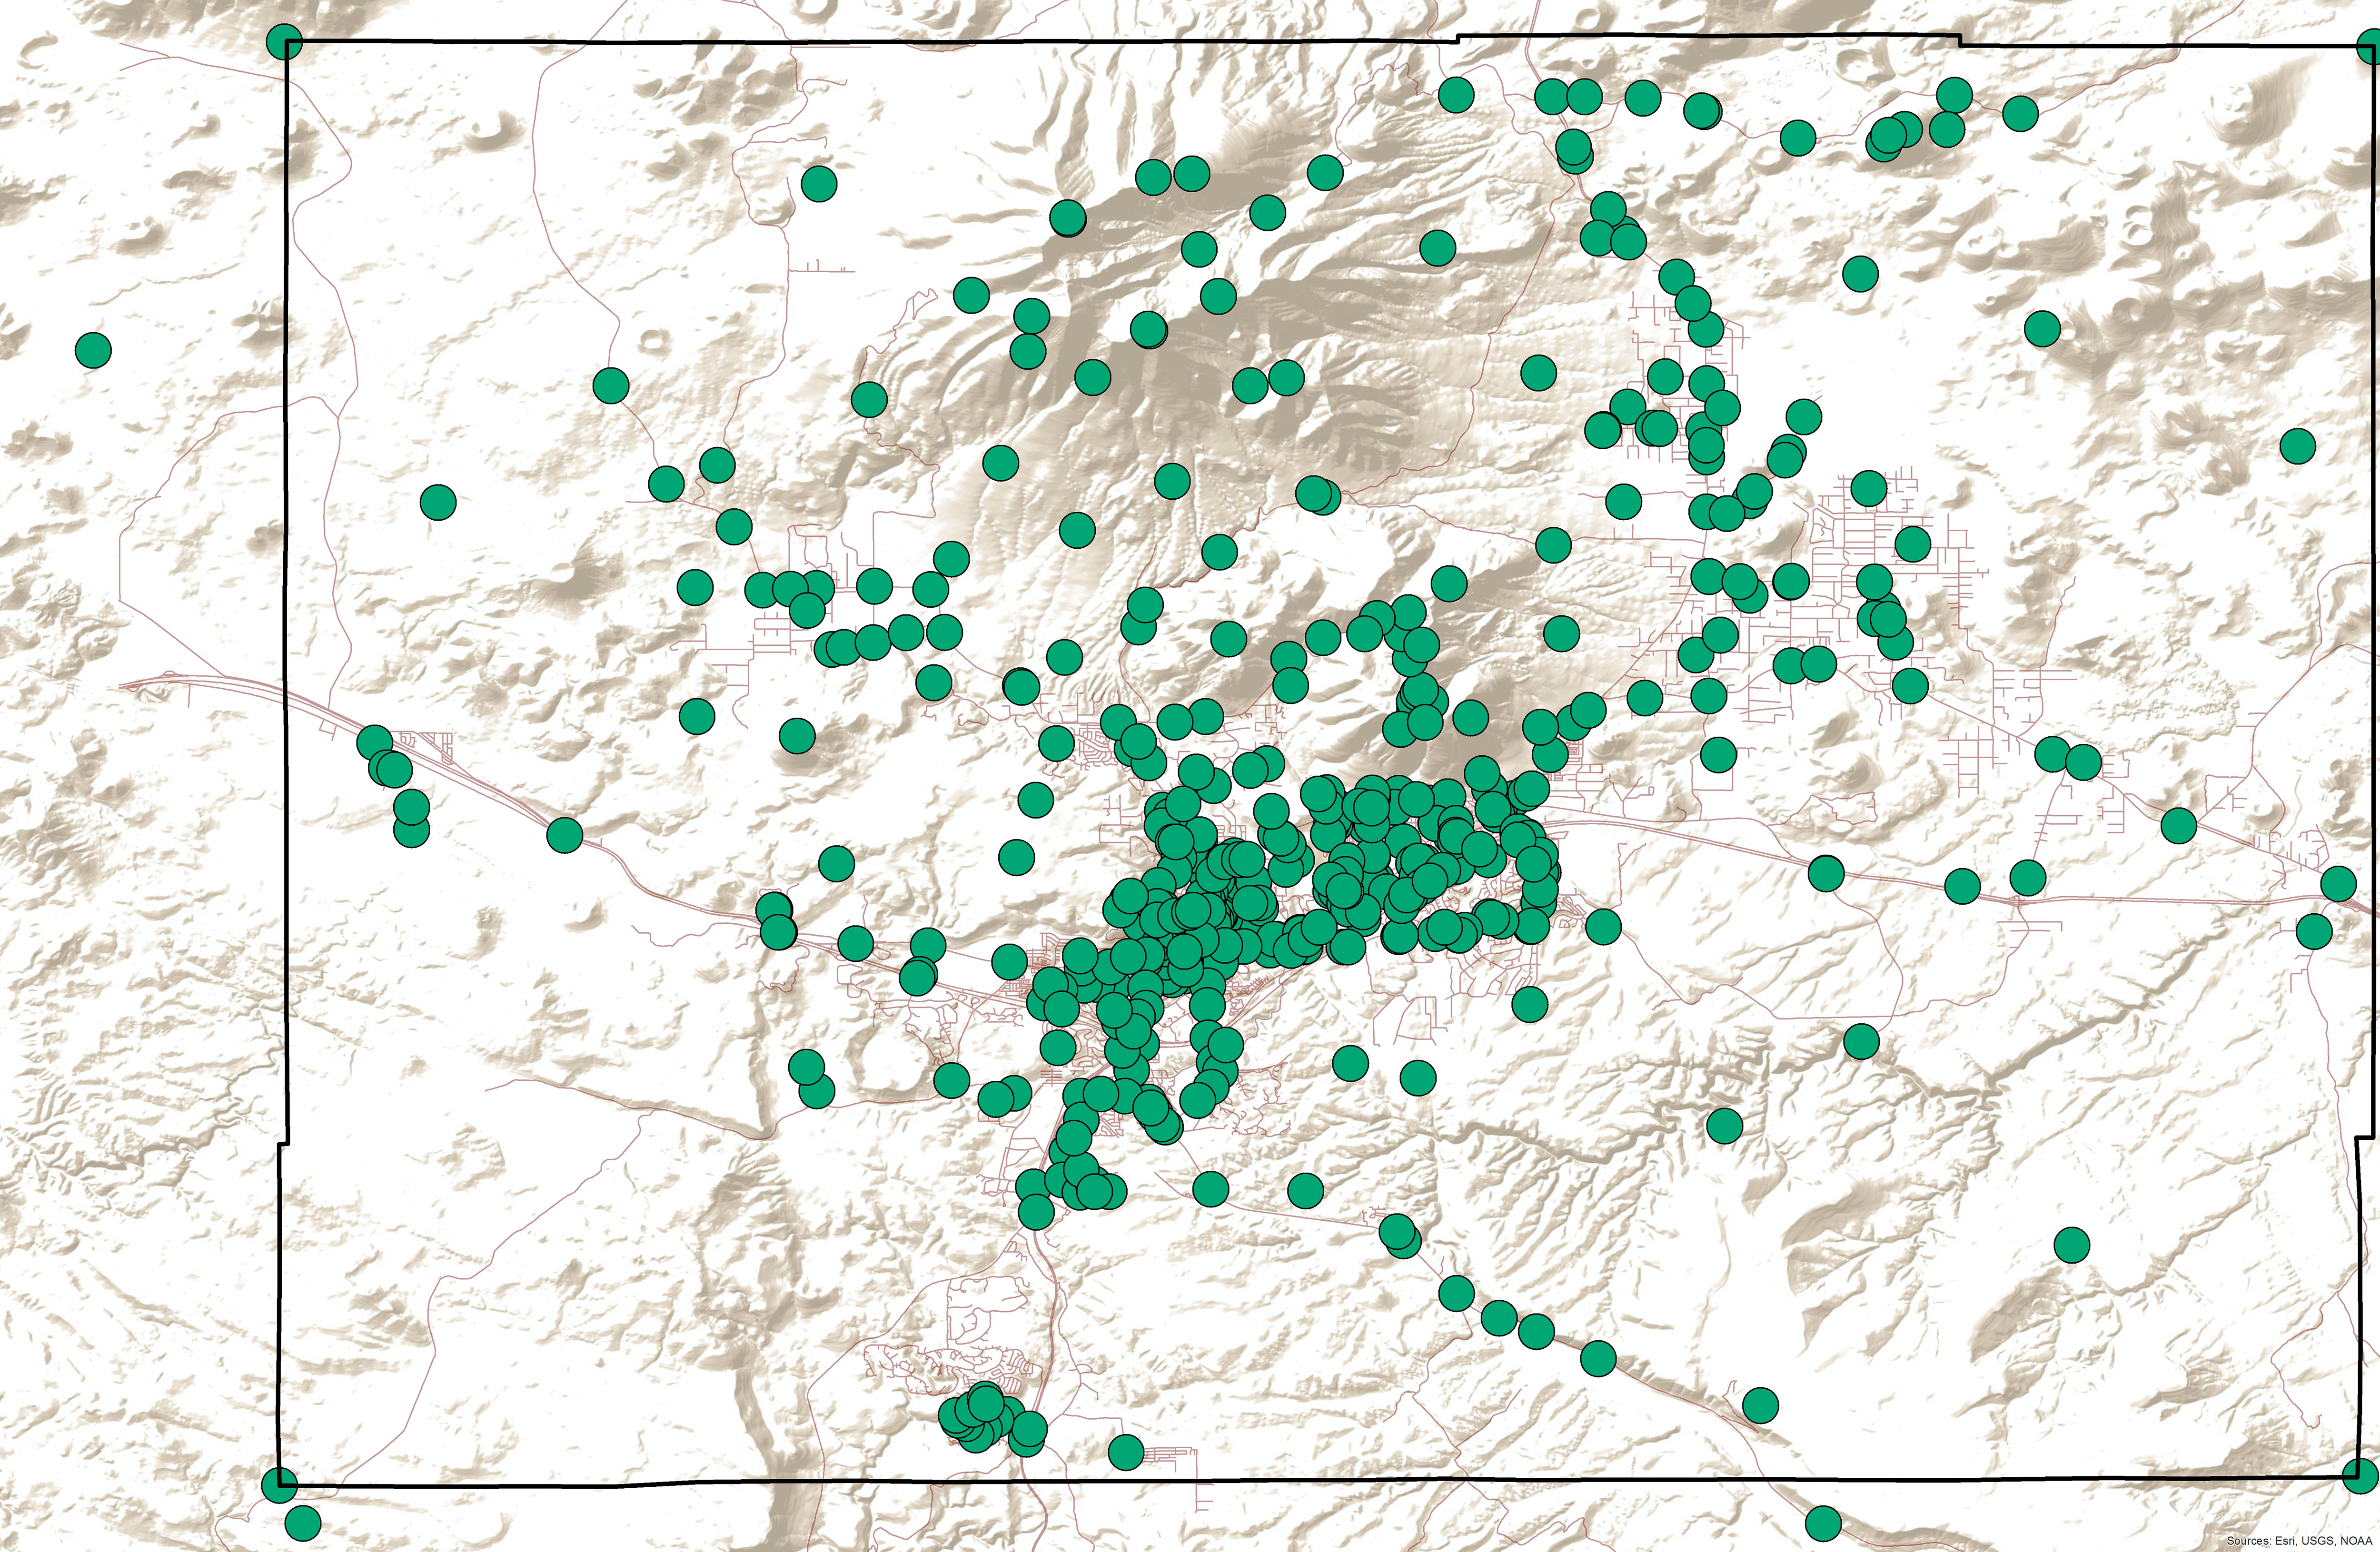
Temperature, precipitation, dewpoint, relative humidity, and wind data were collected from over 500 locations, including public and private weather observation stations and observations recorded in situ, all within the boundaries designated by the Flagstaff Metropolitan Planning Organization (FMPO). This 32 by 43 km area incorporates a range of environments from pinyon-juniper woodland (1,800 m) to alpine tundra (3,800 m), and encompasses the city of Flagstaff and the communities of Bellemont, Doney Park, Fort Valley, Kachina Village, Mountainaire, and Winona. As microclimate classification has not been done in this area on such a fine scale before, the collected data could also form the basis for future climate research.
The collected data were analyzed through Geographic Information Systems (GIS) software and combined into layered maps. The data were further analyzed to determine the average times and extremes for the final and first frosts (below 32°F) and freezes (below 28°F) of spring and fall, as well as the average onset and ending dates of the North American Monsoon.
For the temperature products, data was collected from various sites within the FMPO through CWOP, Mesowest, APRS-IS, APRSWXNET, and data collected in situ using a Kestrel 4000 Pocket Weather Meter. Temperature data collected in situ were recorded only on nights with low to calm wind and low to no cloud cover to ensure consistency.
This data was then mapped using the observations from the Flagstaff-Pulliam Airport (KFLG) as a base. For example, if any given site’s temperature was recorded as 45°F and the Airport observed a temperature of 43°F around the same time, then the site’s temperature is mapped as +2°F. If any given site’s temperature was recorded as 42°F around the same time, then it would be mapped as -1°F. The monthly temperature maps were created with between 240 – 280 data points, depending on the month.
The frost and freeze information was determined from information compiled by the National Weather Service from the Flagstaff-Pulliam Airport. Due to concerns of subjective observational data and changes in instrument location, only data recorded after 1950 were used.
For the precipitation products, data was collected from the University of British Columbia’s ClimateWNA software, which extracts and downscales climate data from Oregon State University PRISM software. The climate data was derived from 30-year normals (1980 to 2010). Per month, a total of 4,978 data points were used.
The monsoon information was determined from observational data from 7 – 9 data points. This data was obtained from Mesowest (mesowest.org) and analyzed over several conditions. For monsoon onset, dates were determined by two (or more) days with at least a 20% chance of precipitation for any given location. For monsoon departure, dates were determined by two (or more) days with less than a 20% chance of precipitation and/or at least a 30% chance of freezing temperatures.
For the wind products, data was collected from various sites within the FMPO through CWOP, Mesowest, APRS-IS, and APRSWXNET. The monthly wind maps were created from 24 data points.